This is not a routine update.
Formlines 2.0 came out of a larger question: what is it we are actually trying to understand when we model a race?
The previous version captured something real. It could see relationships between horses in the same field and often surface strength that was not fully visible in traditional form lines. But the longer we worked with it, the clearer one limitation became: it still looked too shallowly at those relationships.
Some horses carried strength through an entire field without that showing up in a simple direct comparison. Some races contained robust, usable signal. Others looked tidy on the surface but were too thin to rank with real confidence.
At that point it was obvious this would not be solved with cosmetic tweaks, more columns, or one more weighted blend. The engine had to be rebuilt.
Formlines did not emerge in a vacuum
An important precursor was our earlier experiment with Elo-inspired rating logic.
That was our first serious attempt to move away from flat result metrics and instead value performance relative to the quality of opposition. The core idea is simple: a horse’s performance should not be read only as a raw placing, but in relation to who it met and what the field structure implied.
That intuition is close to how Elo is used in chess and other competitive systems, where ratings are adjusted based on expected versus observed outcomes. In the MDPI study on racehorses, Elo was used to reconstruct rankings within races and update each horse’s rating from the gap between expected and actual performance. The researchers selected a K-value of 15 because it produced the best winner prediction in their test set, with 34.1 percent correct winners.
That was an important step for us. Elo taught us to think more relatively, more opponent-aware, and less naively about what a performance actually means.
But Elo also has a natural limit: at its core it is still trying to give the individual a better strength number.
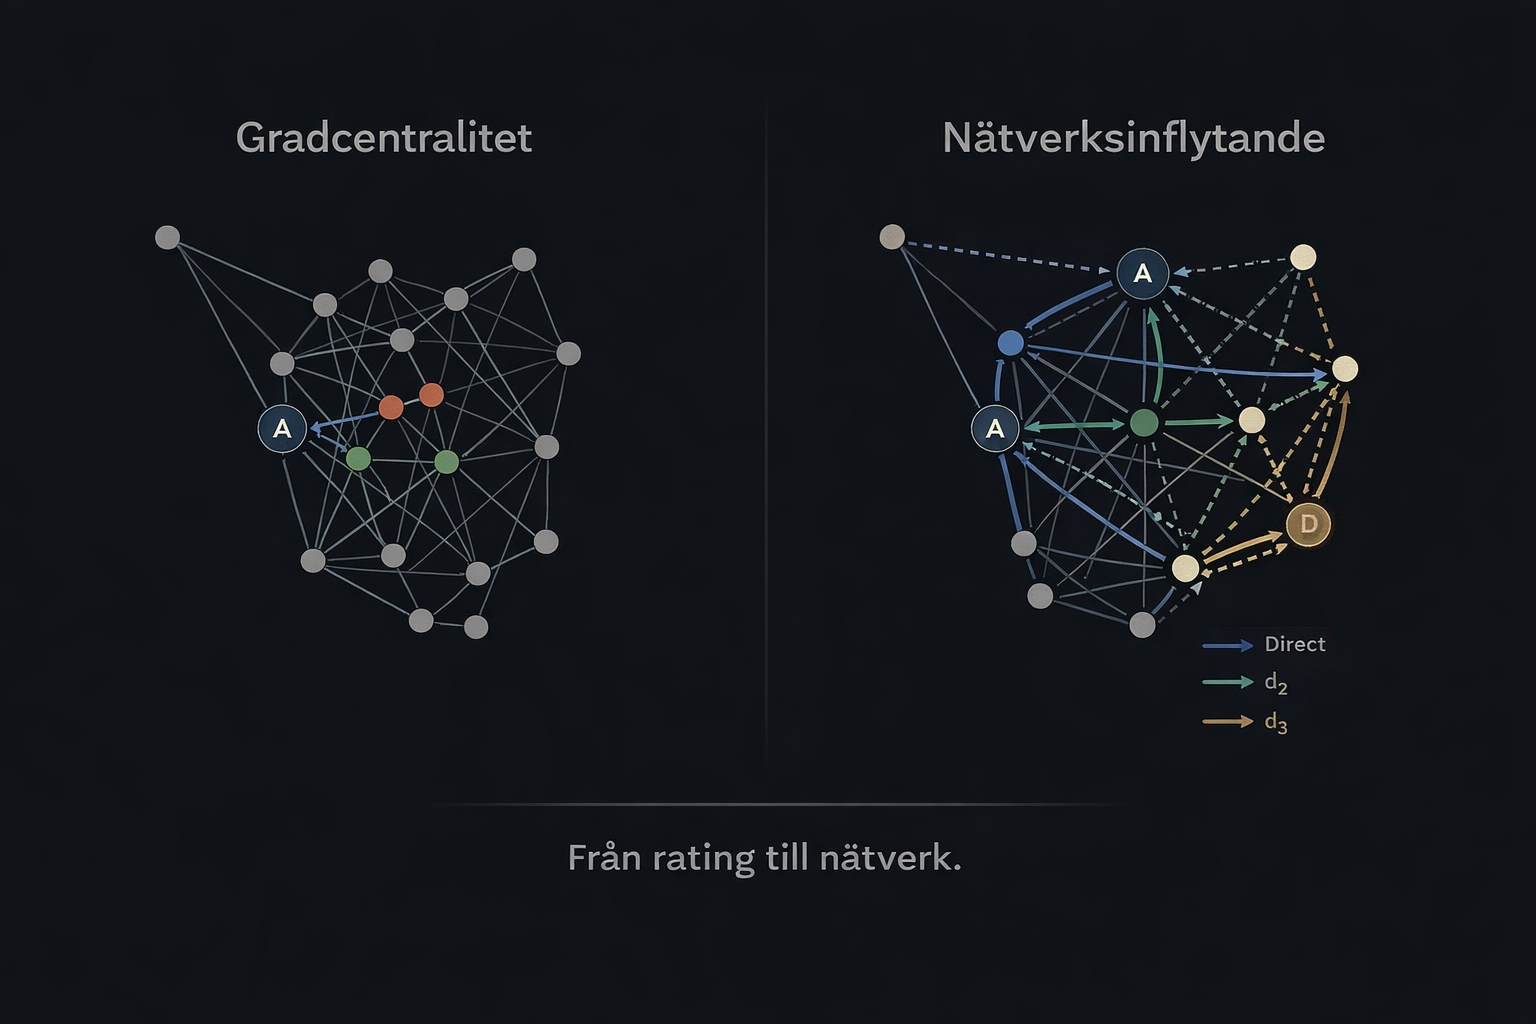
Formlines 2.0 takes the next step. Instead of only asking how strong an individual horse is in rating terms, Formlines tries to understand how strength is embedded in the wider network of relationships inside the field.
From opponent-aware rating to network analysis
This is where network analysis became a relevant source of inspiration.
Ideas like EigenCentrality and PageRank do not only care about direct links. They try to understand how important the surrounding structure is. A node can have many connections and still carry limited real influence if it mainly connects to peripheral parts of the graph. That is also the family of ideas Google once popularized when ranking web pages through links between pages.
This is not the same thing as Google’s PageRank. But the intuition is related. In both cases, direct links alone are not enough. You want to understand how significance, or in our case strength, propagates through a larger network.
That was the moment Formlines started changing from a relational model into a true network layer.
The old layer: valuable, but shallow
The previous Formlines layer was built on an idea that is still strong: there are within-field strength relationships between horses that ordinary form rows often miss.
That is still true. Not every race is best explained by raw speed, market share, or the latest result line. Often there are underlying relationships inside the field that say more than standard statistics do. A horse may have faced better opposition than the line suggests. A placing may matter more than it first appears. A race can carry structure that conventional metrics do not quite capture.
But the old model had three clear weaknesses:
- it leaned mainly on direct relationships
- it expressed uncertainty too weakly in thin races
- it lacked a strong enough historical, predictive testing setup
The last point was decisive. A model can describe the past in a way that looks intelligent without actually producing durable forward signal. To move forward we had to separate something that looks good in sample from something that holds up under historically correct testing.
That required a new architecture.
Networks instead of isolated comparisons
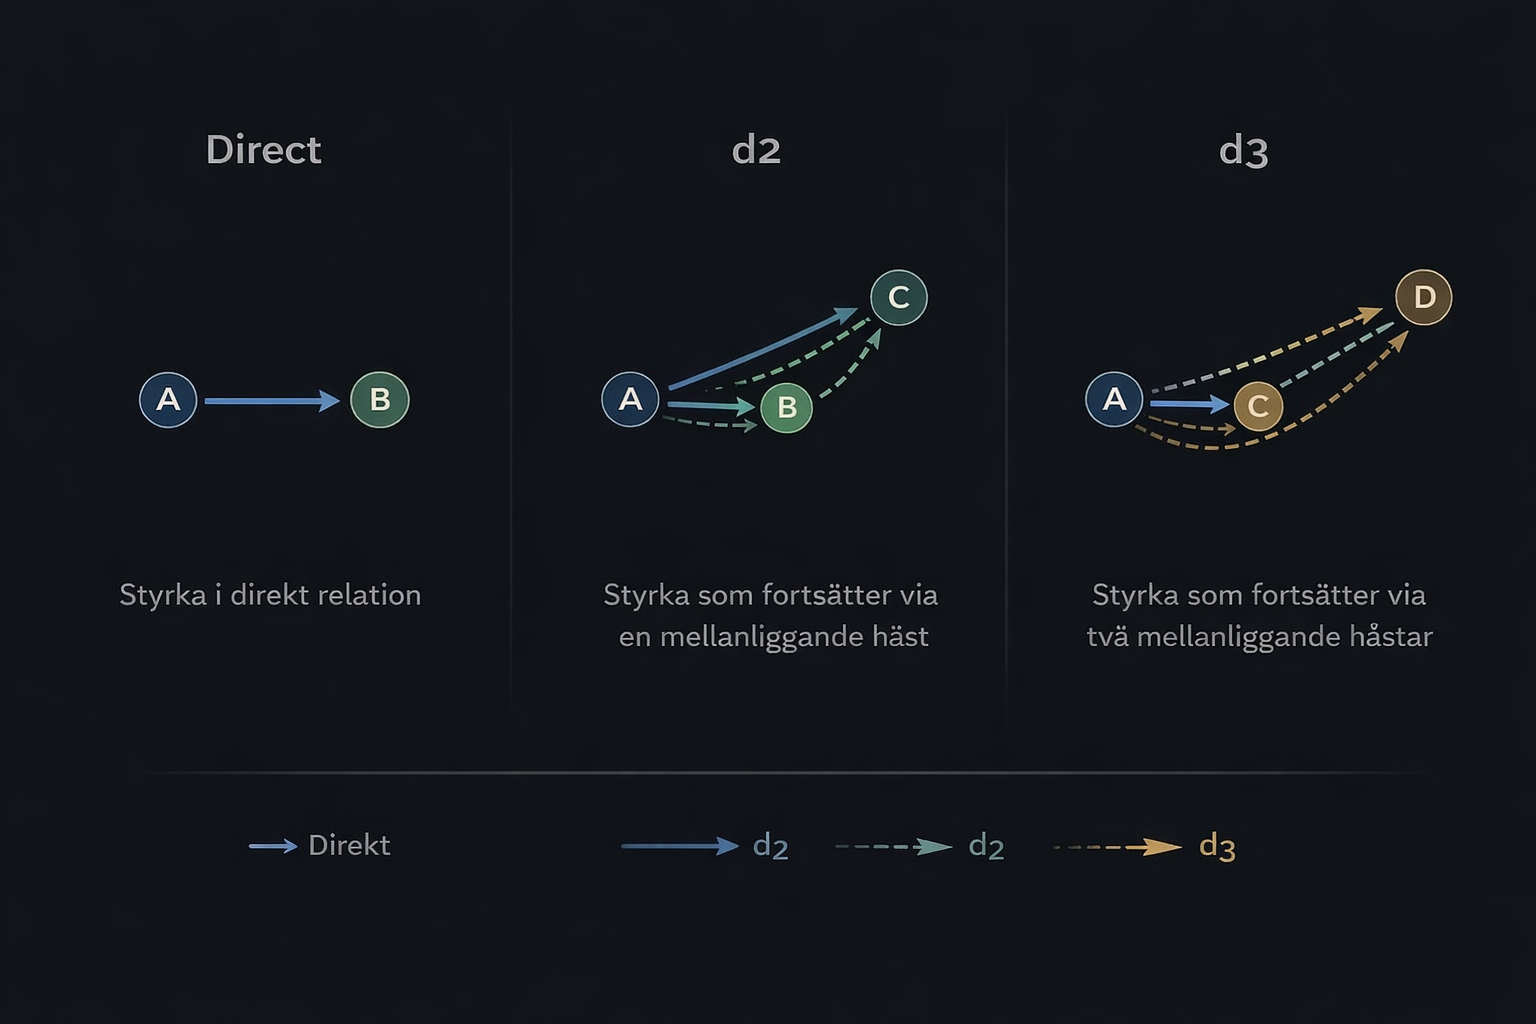
The core idea behind FL4 started with a simple principle: if horse A has shown strength against B, and B has shown strength against C, then there is information there that should not be thrown away just because A and C have not met directly.
From there, the network view took shape.
In the new model, each horse becomes a node in a directed graph, and each historical strength relationship becomes an edge. Once that structure exists, the race can be analysed in layers rather than in a single pass.
We now work with three main signal layers:
- Direct strength — real, direct relationships between horses
- d2 — second-order signal, where strength travels through one intermediate horse
- d3 — third-order signal, where the network becomes deep enough to start capturing genuine field structure
This is not just a more advanced way of counting. It changes what the model can actually see. There is a real difference between a horse that looks strong in a thin direct relationship and one that sits centrally inside a connected dominance network with multiple supporting paths through the field.
Why we could not just blend everything together
The first instinct was to build a combined model where direct, d2 and d3 were all blended into a single score layer.
For direct plus d2 that worked reasonably well. Once d3 entered the picture, the shape changed. Some outputs became too large. Too many indirect paths created too much mass. Horses inside dense graphs could receive disproportionately strong scores, not necessarily because the signal was better, but because the topology made the accumulation explode.
That was an important lesson. The problem was not that d3 was weak. The problem was that d3 was too powerful to be handled naively.
It needed to be normalised, tested separately, and used with more discipline than as just another component in a simple blend. That became one of the clearest turning points in the whole build.
The first real signal: d3 was stronger than expected
Once we had a target-safe, historically correct testing chain in place, the model started giving real answers.
Over a 30-day window the outcome looked like this:
- direct_target: 123 / 792 — 15.5%
- d2_target: 106 / 585 — 18.1%
- d3_target: 96 / 479 — 20.0%
- legacy: 175 / 966 — 18.1%
This was an important moment. Not only because d3 looked good, but because it looked like the strongest FL4 layer in the part of the universe where it actually had coverage.
It confirmed something we had started to suspect during development: there is real value in allowing signal to move deeper through the network, as long as the model also controls how much weight is allowed to accumulate.

Confidence stopped being a detail and became central
When a model works deeper inside a network, it is no longer enough to say which horse is ranked first. It also has to say how much substance actually sits behind that top ranking.
That is why the confidence layer became central in Formlines 2.0. We built it in two levels.
Structural confidence
This is the model’s internal reading of race signal strength: how much direct signal actually exists, how dense and connected the relationship graph is, whether d2 and d3 have real coverage, and how clear the top of the ranking is.
Empirical context-confidence
The second layer is not based on structure but on actual historical hit-rate data. Here we saw clear differences across race environments.
Formlines performed better in smaller fields, especially at eight runners or fewer, in older-horse races, in longer distances, and on non-Swedish tracks. It was weaker in larger fields, younger-horse races, sprint races, and Swedish tracks relative to non-Swedish ones.

From weighted ranking to decision logic
One of the biggest conclusions from the work was that not everything should be reduced to one ranking formula.
Instead, a clearer layer logic emerged: use d3 when coverage is strong enough, fall back to d2 when d3 is too thin, use the direct layer when higher-order signal is missing, and abstain completely when the race does not carry enough real signal.
This matters for two reasons. First, the model becomes more interpretable. It becomes easier to understand why a signal appears and why some races should not be forced into a false sense of certainty. Second, it aligns better with what the data actually shows.
What this means in the product
This work is not an internal academic exercise. It changes how Formlines can be used live.
With the new engine we get better conditions for stronger race-level confidence, more robust ranking, clearer signal when a race is genuinely carrying structure, better identification of races that are too thin, and a stronger base for visualization, analysis and premium content.
It also creates a new platform for other products on top of Formlines: clearer Formlines cards inside Alpha, better Formlines layers in live surfaces, and stronger support for Vinnare and other race-level signal products.
This is not just a feature update. It is infrastructure.
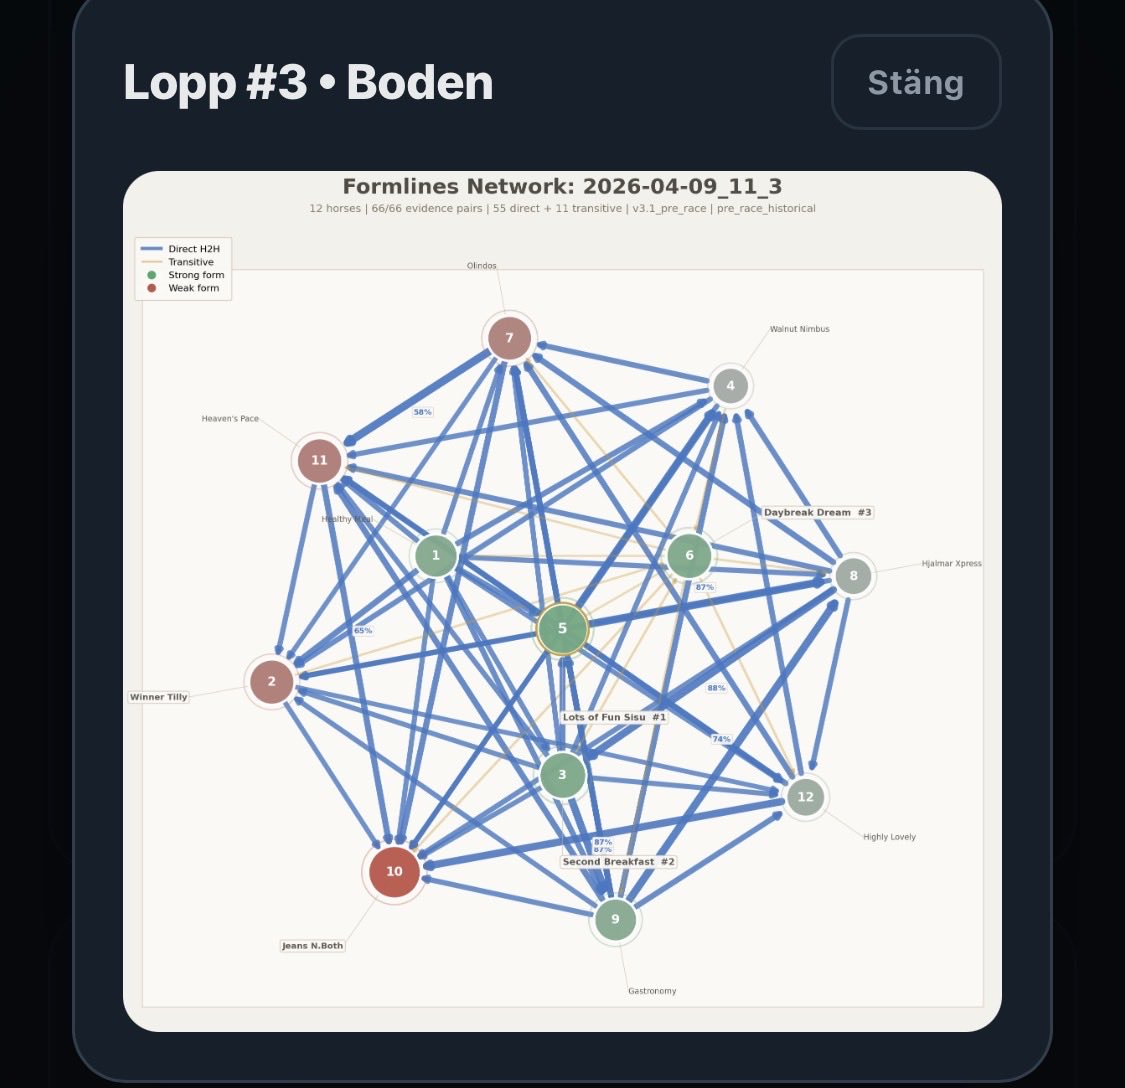
The visualization also has to earn premium status
Another important insight was that the Formlines graphic cannot feel like a technical side effect.
If the network is going to become a real part of the product, the picture has to communicate three things quickly: which horse actually looks strongest, whether the race is tight or fragmented, and the difference between clear direct strength and weaker transitivity.
We have already improved the rendering significantly: larger canvas, stronger visual hierarchy in nodes and links, less noisy structure without signal value, stronger edge weights, and clearer labels on important relationships.
But the longer-term ambition is larger than that. The Formlines image should not feel like a debug view. It should feel like a signature visualization for the model.
What remains
The rebuild has given us a much clearer direction, but the work is not finished.
Next steps include expanding coverage where d3 is still thin, refining the confidence model further, improving the live visualization, defining how Formlines should be used in other products without being overused, and running larger historically clean evaluations.
What matters is that we now know much more than when the work began. We know d3 carries real value. We know confidence must be built from both structure and actual hit-rate behaviour. We know some race environments are clearly better for the model than others. And we know Formlines is no longer just an alternative ranking row.
It has become a real network layer.
Closing
The most interesting thing about Formlines 2.0 may not be that the model became more advanced. The most interesting thing is that it became more self-critical.
It does not only say: here is my top horse. It also starts saying why that horse ends up there, how deep the signal actually runs, and when the race does not deserve a confident interpretation.
That is a better way to build models for real race-day betting. And this is only the beginning.